08 of 13
Fathom
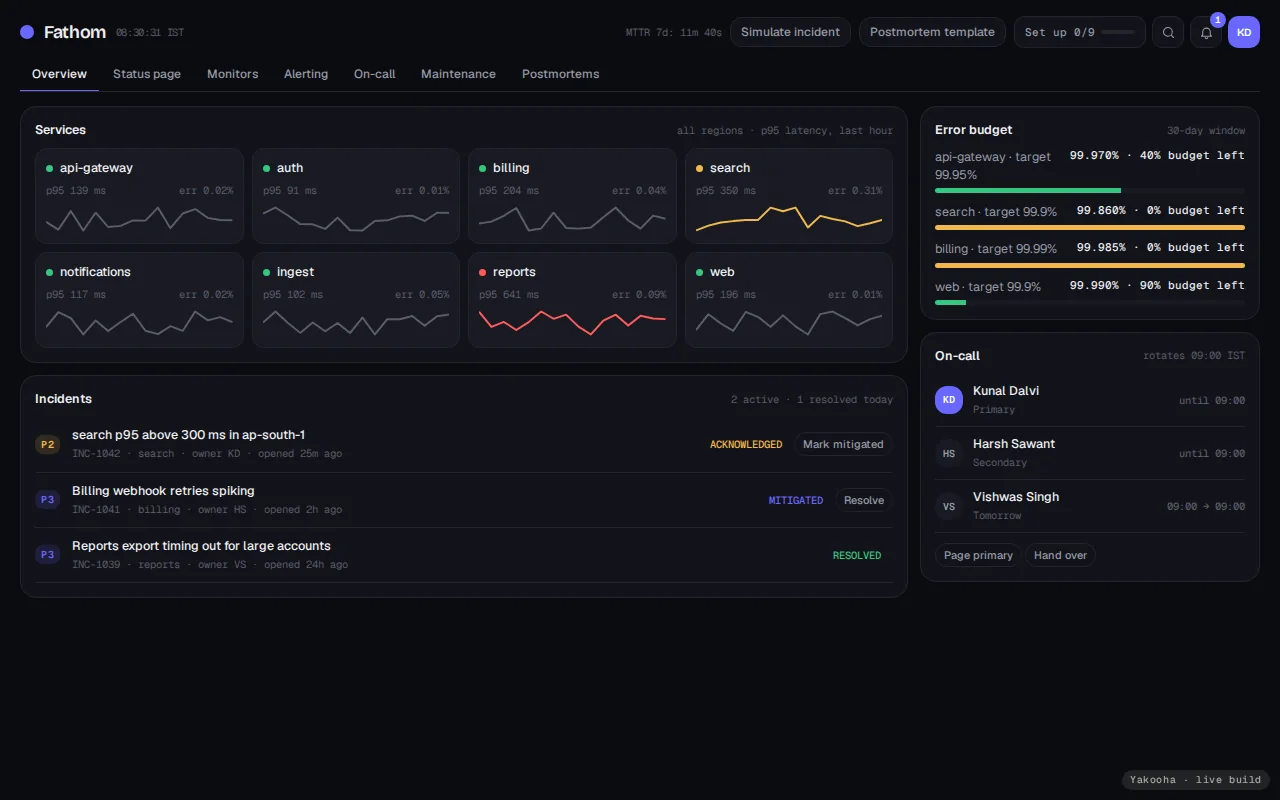
An operations dashboard that replaces a wall of spreadsheets with one screen an ops lead can trust at 6am.
- Year
- 2026
- Disciplines
- Product Design
- Platform
- Web app
- Brief
- Sample client
01Context
Fathom’s ops team ran the business out of a dozen spreadsheets. We designed a single source of truth they could act on, not just admire.
02Problem
Ops dashboards are where good intentions go to die — too dense, too slow to change. This one had to stay useful as the business shifted under it.
- Dense information that stays scannable
- Alerts that mean something
- A layout that adapts to new metrics
- Trust — numbers that always reconcile
03Strategy
We shadowed the team for a week, learned which numbers actually drove decisions, and designed around those.
- A priority-led information hierarchy
- Thresholds and alerts co-designed with ops
- A flexible grid for metrics yet to exist
- A component kit their engineers could ship
04Design
05Engineering
A Go collector streams service heartbeats over WebSockets into TimescaleDB; the React/TypeScript console renders incident state machines, and Grafana handles the long-tail dashboards ops already trusts.
- Go collector: 40k heartbeats/s on one small node
- Incident lifecycle as an explicit state machine
- WebSocket fan-out with backpressure handling
- Timescale continuous aggregates for uptime bars
Also considered. Node for the collector — Go's goroutines and memory profile won the ingestion path.
06Details
The mechanism underneath, as a working model. Press the buttons.
lab / ops / incident state machine
Open → acknowledged → mitigated → resolved, with every transition audited and every timer explicit.
Loading the model
Figures inside a model are simulated to show how the mechanism behaves. They are not production measurements.
07What shipped
9 modules are in the build below. Each one works.
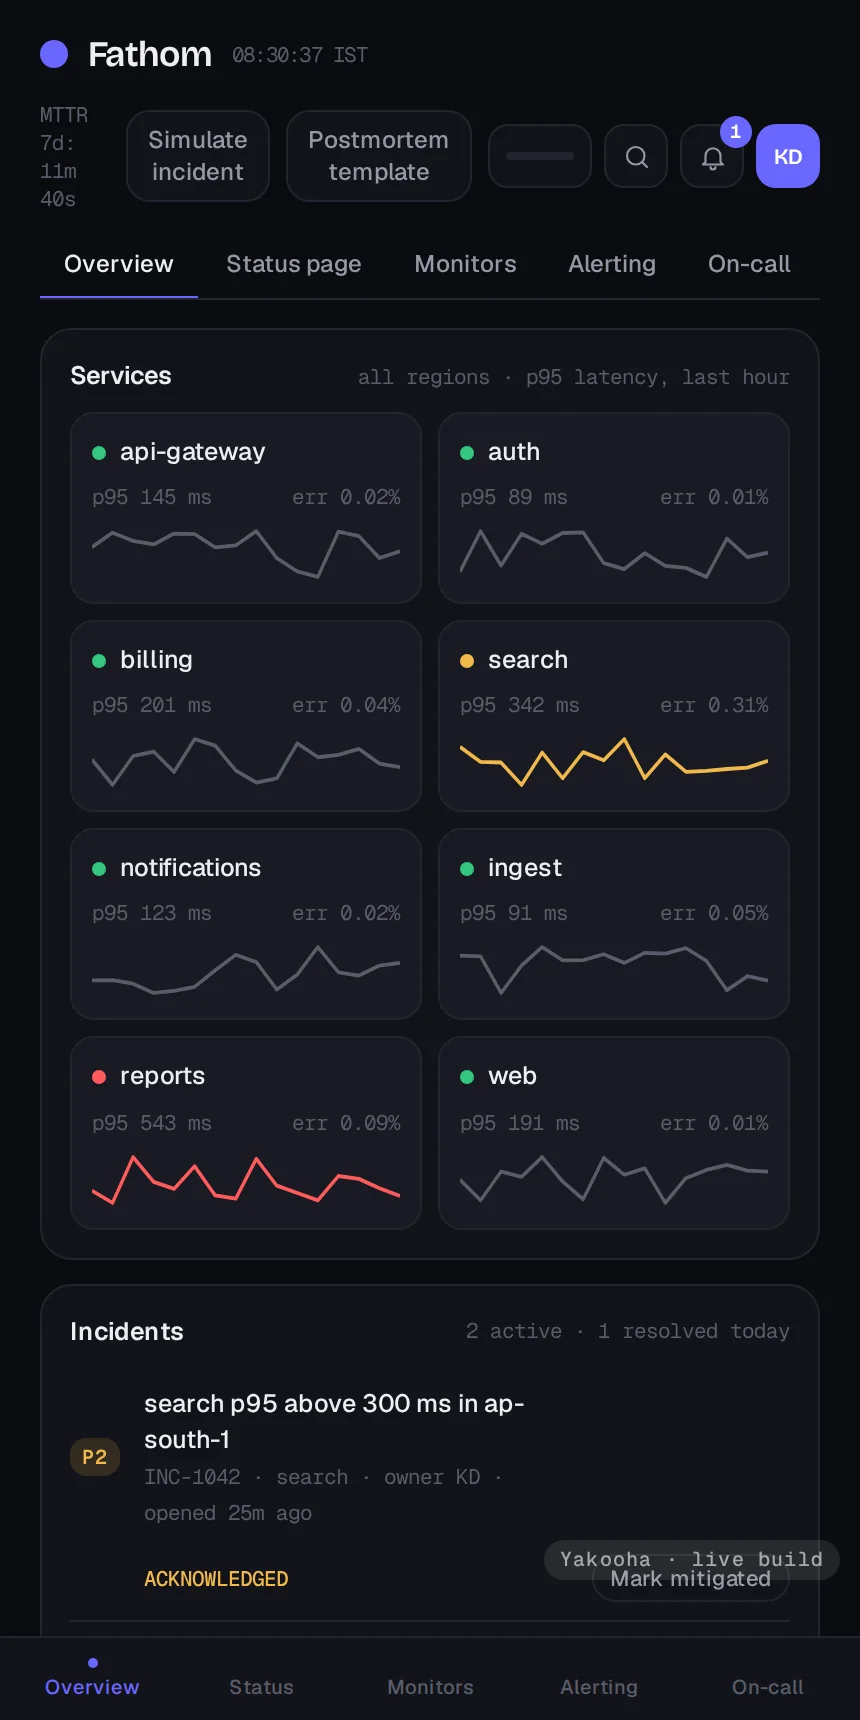
- 01Service sparklines
- 02Incident drawer with a legal state machine, timeline, notes and reassignment
- 03Error budgets
- 04On-call handover and rotation with overrides
- 05Simulate an incident
- 06Postmortem download
- 07Public status page
- 08Monitors, alert rules and escalation policies
- 09Maintenance windows
08Technology
This is the kind of work we do under UI/UX & Product Design.
Now use it.
This is Fathom, the whole application. Continue as the sample user, change things, reload. Your data stays in this browser and resets from Settings, then Data.
A full application, not a recording. Sign in as the sample user; your data stays in this browser.